April 2018
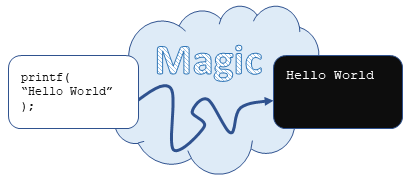
If 'Hello World' is the first program for C students, then printf() is probably the first function. I've had to answer questions about printf() many times over the years, so I've finally set aside time for an informal writeup. The common questions fit roughly in to two forms:
- Easy: How does printf mechanically solve the format problem?
- Complex: How does printf actually display text on my console?
My usual answer?
"Just open up stdio.h and track it down"
This wild goose chase is not only a great learning experience, but also an interesting test for the dedicated beginner. Will they come back with an answer? If so, how detailed is it? What IS a good answer?
printf() in 30 seconds - TL;DR edition
printf's execution is tailored to your system and generally goes like this:
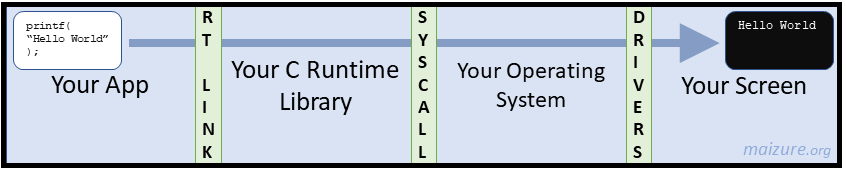
- Your application uses printf()
- Your compiler/linker produce a binary. printf is a load-time pointer to your C library
- Your C runtime fixes up the format and sends the string to the kernel via a generic write
- Your OS mediates the string's access to its console representation via a device driver
- Text appears in your screen
...but you probably already knew all that.
This is the common case for user-space applications running on an off-the-shelf system. (Side-stepping virtual/embedded/distributed/real-mode machines for the moment).
A more complicated answer starts with: It depends -- printf mechanics vary across long list of things: Your compiler toolchain, system architecture to include the operating system, and obviously how you've used it in your program. The diagram above is generally correct but precisely useless for any specific situation.
If you're not impressed, that's good. Let's refine it.
printf() in 90 seconds - Interview question edition
- You include the <stdio.h> header in your application
- You use printf non-trivially in your app.
- Your compiler produces object code -- printf is recognized, but unresolved
- The linker constructs the executable, printf is tagged for run-time resolution
- You execute your program. Standard library is mapped in the process address space
- A call to printf() jumps to library code
- The formatted string is resolved in a temporary buffer
- Standard library writes to the stdout buffered stream. Eventual kernel write entry
- Kernel calls a driver write operation for the associated console
- Console output buffer is updated with the new string
- Output text appears on your console
Sounds better? There's still a lot missing, including any mention of system specifics. More things to think about (in no particular order):
- Are we using static or dynamic linkage? Normally printf is run-time linked, but there are exceptions.
- What OS is this? The differences between them are drastic - When/how is stdout managed? What is the console and how is it updated? What is the kernel entry/syscall procedure...
- Closely related to the OS...what kind of executable is this? If ELF, we need to talk about the GOT / PLT. If PE (Windows), then we need an import directory.
- What kind of terminal are you using? Standard laptop/desktop? University cluster over ssh? Is this a virtual machine?
- This list could go on forever, and all answers affect what really happens behind the scenes.
Things to know before continuing
The next part is targeted for C beginners who want to explore how functions execute through a complex system. I'm keeping the discussion at a high-level so we can focus on how many parts of the problem contribute to a whole solution. I'll provide references to source code and technical documents so readers can explore on their own. No blog substitutes for authoritative documentation.
Now for a more important question:
Why do beginners get stuck searching for a detailed answer about basic functions like printf()?
I'll boil it down to three problems:
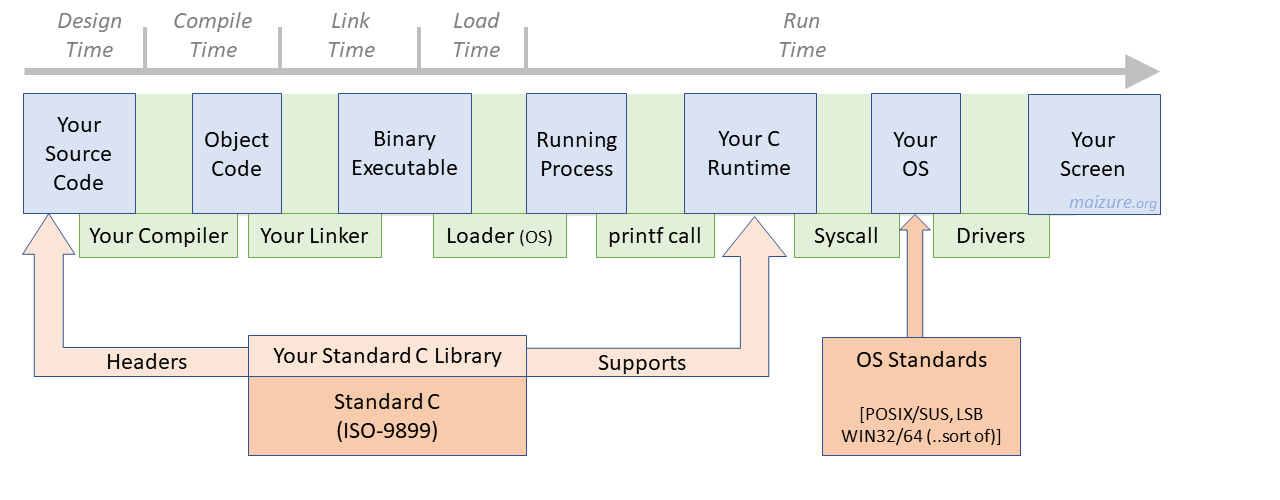
Not understanding the distinct roles of the compiler, standard library, operating system, and hardware. You can't look at just one aspect of a system and expect to understand how a function like printf() works. Each component handles a part of the 'printf' problem and passes the work to the next using common interfaces along the way. C compilers try to adhere to the ISO C standards. Operating systems may also follow standards such as POSIX/SUS. Standardization streamlines interoperability and portability, but with the cost of code complexity. Beginners often struggle following the chain of code, especially when the standard requirements end and the 'actual work' begins between the interfaces. The common complaint: Too many seemingly useless function calls between the interface and the work. This is the price of interoperability and there's no easy + maintainable + scalable way around it!
Not grasping [compile/link/load/run]-time dynamics. Manual static analysis has limits, and so following any function through the standard library source code inevitably leads to a dead end -- an unresolved jump table, an opaque macro with multiple expansions, or a hard stop at the end: an ambiguous function pointer. In printf's case, that would be *write, which the operating system promises will be exist at run-time. Modern compilers and OSs are designed to be multi-platform and thus every possible code path that could exist is visible prior to compilation. Beginners may get lost in a code base where much of the source 'compiles away' and functions resolve dynamically at execution. Trivial case: If you call printf() on a basic string without formats, your compiler may emit a call to 'puts', discarding your printf entirely!
Not enough exposure to common abstractions used in complex software systems. Tracing any function through the compiler and OS means working through many disparate ideas in computing. For instance, many I/O operations involve the idea of a character stream. Buffering character I/O with streams has been part of Unix System V since the early 1980s, thanks in part to Dennis Ritchie, co-author of 'The C Programming Language'. Since the 1990s, multiprocessing has become the norm. Tracing printf means stepping around locks, mutexes, semaphores, and other synchronization tools. More recently, i18n has upped the ante for simple console output. All these concepts taken together often distract and overwhelm beginners who are simply trying to understand one core problem.
Bottom line: Compilers, libraries, operating systems, and hardware are complex; we need to understand how each works together as a system in order to truly understand how printf() works.
printf() in 1000 seconds - TMI edition
(or 'Too-specific-to-apply-to-any-system-except-mine-on-the-day-I-wrote-this edition')
The best way to answer these questions is to work through the details on an actual system.
$uname -a
Linux localhost.localdomain 3.10.0-693.el7.x86_64 #1 SMP Tue Aug 22 21:09:27 UTC 2017 x86_64 x86_64 x86_64 GNU/Linux

$gcc --version
gcc (GCC) 4.8.5 20150623 (Red Hat 4.8.5-16)
Copyright (C) 2015 Free Software Foundation, Inc.
This is free software; see the source for copying conditions.  There is NO
warranty; not even for MERCHANTABILITY or FITNESS FOR A PARTICULAR PURPOSE.

$ldd --version
ldd (GNU libc) 2.17
Copyright (C) 2012 Free Software Foundation, Inc.
This is free software; see the source for copying conditions.  There is NO
warranty; not even for MERCHANTABILITY or FITNESS FOR A PARTICULAR PURPOSE.
Written by Roland McGrath and Ulrich Drepper.
Key points:
- Linux kernel 3.10 (source code)
- glibc version 2.17 (source code)
- x86-64 ABI
- GCC version 4.8.5
- CentOS 7
Step 0 - What is printf?
printf() is an idea that the folks at Bell Labs believed in as early as 1972: A programmer should be able to produce output using various formats without understanding exactly what's going on under the hood.
This idea is merely an interface.
The programmer calls printf and the system will handle the rest. That is why you're presumably reading this article -- hiding implementation details works!
Early compilers supported programmers exclusively through built-in functions. When toolchains became a business in the early 1980s (Manx/Aztec C, Lattice C), many provided C and ASM source code for common functions that developers could #include in their projects as needed. This allowed customization of built-ins at the application level -- no more rebuilding your toolchain for each project. However, programmers were still at the mercy of various brands of compilers, each bringing their own vision of how to implement these functions and run-time.
Thankfully, most of this hassel has gone away today. So if you want to use printf...
Step 1 - Include the <stdio.h> header
Goal: Tap into the infinite power of the C standard library
The simple line of code #include <stdio.h> is possible across the vast majority of computer systems thanks to standards. Specifically, ISO-9899.
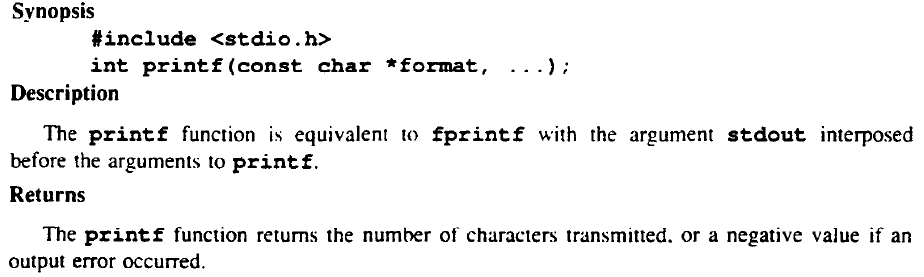
In 1978, Brian Kernighan and Dennis Ritchie described printf in its full variadic form to include nine types of formats:
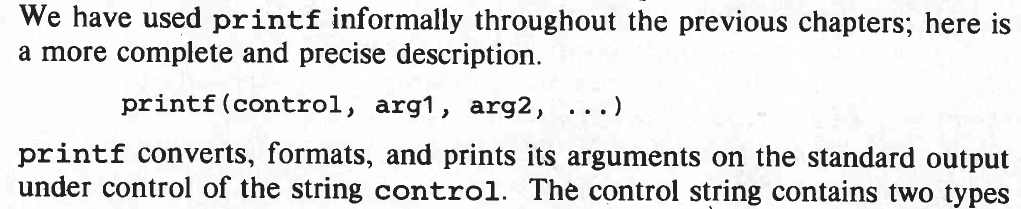
printf(control, arg1, arg2, ...); # K&R (1st ed.)
This was as close as the industry would get to a standard for the next decade. Between 1983 and 1989, the ANSI committee worked on the formal standard that eventually brought the printf interface to its familiar form:
int printf(const char *format, ...); # ANSI C (1989)
Here's an oft-forgotten bit of C trivia: printf returns a value (the actual character output count). The interface from 1978 didn't mention a return value, but the implied return type is integer under K&R rules. The earliest known compiler (linked above) did not return any value.
The most recent C standard from 2011 shows that the interface changed by only one keyword in the intervening 20 years:
int printf(const char * restrict format, ...); # Latest ISO C (2011)
'restrict' (a C99 feature) allows the compiler to optimize without concern for pointer aliasing.
Over the past 40 years, the interface for printf is mostly unchanged, thus highly backwards compatible. However, the feature set has grown quite a bit:
| 1972 | 1978 | 1989 | 2011 |
|---|---|---|---|
| %d - decimal | Top 3 from '72 | All from '78 plus... | Too many! |
| %o - octal | %x - hexadecimal | %i - signed int | Read |
| %s - string | %u - unsigned decimal | %p - void pointer | the |
| %p - string ptr | %c - byte/character | %n - output count | manual |
| %e,f,g - floats/dbl | %% - complete form | pp. 309-315 |
Step 2 - Use printf() with formats
Goal: Make sure your call to printf actually uses printf()
We'll test out printf() with two small plagarized programs. However, only one of them is truly a candidate to trace printf().
| Trivial printf() - printf0.c | Better printf() - printf1.c |
|---|---|
$ cat printf0.c
#include <stdio.h>

int main(int argc, char **argv)
{
  printf("Hello World\n");
  return 0;
}
|
$ cat printf1.c
#include <stdio.h>

int main(int argc, char **argv)
{
  printf("Hello World %d\n",1);
  return 0;
}
|
The difference is that printf0.c does not actually contain any formats, thus there is no reason to use printf. Your compiler won't bother to use it. In fact, you can't even disable this 'optimization' using GCC -O0 because the substitution (fold) happens during semantic analysis (GCC lingo: Gimplification), not during optimization. To see this in action, we must compile!
Possible trap: Some compilers may recognize the '1' literal used in printf1.c, fold it in to the string, and avoid printf() in both cases. If that happens to you, substitute an expression that must be evaluated.
Step 3 - Compiler produces object code
Goal: Organize the components (symbols) of your application
Compiling programs results in an object file, which contains records of every symbol in the source file. Each .c file compiles to a .o file but none of seen any other files (no linking yet). Let's look at the symbols in both of the programs from the last step.
| Trivial printf() | More useful printf() |
|---|---|
$ gcc printf0.c -c -o printf0.o
$ nm printf0.o
0000000000000000 T main
                 U puts
|
$ gcc printf1.c -c -o printf1.o
$ nm printf1.o
0000000000000000 T main
                 U printf
|
As expected, the trivial printf usage has a symbol to a more simple function, puts. The file that included a format instead as a symbol for printf. In both cases, the symbol is undefined. The compiler doesn't know where puts() or printf() are defined, but it knows that they exist thanks to stdio.h. It's up to the linker to resolve the symbols.
Step 4 - Linking brings it all together
Goal: Build a binary that includes all code in one package
Let's compile and linking both files again, this time both statically and dynamically.
$ gcc printf0.c -o printf0            # Trivial printf dynamic linking
$ gcc printf1.c -o printf1            # Better printf dynamic linking
$ gcc printf0.c -o printf0_s -static  # Trivial printf static linking
$ gcc printf1.c -o printf1_s -static  # Better printf static linking
Possible trap: You need to have the static standard library available to statically link (libc.a). Most systems already have the shared library built-in (libc.so). Windows users will need a libc.lib and maybe a libmsvcrt.lib. I haven't tested in an MS environment in a while.
Static linking pulls all the standard library object code in to the executable. The benefit for us is that all of the code executed in user space is now self-contained in this single file and we can easily trace to see the standard library functions. In real life, you rarely want to do this. This disadvantages are just too great, especially for maintainability. Here's an obvious disadvantage:
$ ls -l printf1*
total 1696
-rwxrwxr-x. 1 maiz maiz   8520 Mar 31 13:38 printf1     # Dynamic
-rw-rw-r--. 1 maiz maiz    101 Mar 31 12:57 printf1.c
-rw-rw-r--. 1 maiz maiz   1520 Mar 31 13:37 printf1.o
-rwxrwxr-x. 1 maiz maiz 844000 Mar 31 13:40 printf1_s   # Static
Our test binary blew up from 8kb to 844kb. Let's take a look at the symbol count in each:
$ nm printf1.o | wc -l
2                      # Object file symbol count (main, printf)
$ nm printf1 | wc -l
34                     # Dynamic-linked binary symbol count
$ nm printf1_s | wc -l
1873                   # Static-linked binary symbol count
Our original, unlinked object file had just the two symbols we already saw (main and printf). The dynamic-linked binary has 34 symbols, most of which correspond to the C runtime, which sets up the environment. Finally, our static-linked binary has nearly 2000 symbols, which include everything that could be used from the standard library.
As you may know, this has a significant impact on load-time and run-time
Step 5 - Loader prepares the run-time
Goal: Set up the execution environment
The dynamic-linked binary has more work to do than its static brother. The static version included 1873 symbols, but the dynamic binary only inluded 34 with the binary. It needs to find the code in shared libraries and memory map it in to the process address space. We can watch this in action by using strace.
Dynamic-linked printf() syscall trace
$ strace ./printf1
execve("./printf1", ["./printf1"], [/* 47 vars */]) = 0
brk(NULL) = 0x1dde000
mmap(NULL, 4096, ..., -1, 0) = 0x7f59bce82000
access("/etc/ld.so.preload", R_OK) = -1 ENOENT
open("/etc/ld.so.cache", O_RDONLY|O_CLOEXEC) = 3
fstat(3, {st_mode=S_IFREG|0644, st_size=83694, ...}) = 0
mmap(NULL, 83694, PROT_READ, MAP_PRIVATE, 3, 0) = 0x7f59bce6d000
close(3) = 0
open("/lib64/libc.so.6", O_RDONLY|O_CLOEXEC) = 3
read(3, "\177ELF"..., 832) = 832
fstat(3, {st_mode=S_IFREG|0755, st_size=2127336, ...}) = 0
mmap(NULL, 3940800, ..., 3, 0) = 0x7f59bc89f000
mprotect(0x7f59bca57000, 2097152, PROT_NONE) = 0
mmap(0x7f59bcc57000, 24576, ..., 3, 0x1b8000) = 0x7f59bcc57000
mmap(0x7f59bcc5d000, 16832, ..., -1, 0) = 0x7f59bcc5d000
close(3) = 0
mmap(NULL, 4096, ..., -1, 0) = 0x7f59bce6c000
mmap(NULL, 8192, ..., -1, 0) = 0x7f59bce6a000
arch_prctl(ARCH_SET_FS, 0x7f59bce6a740) = 0
mprotect(0x7f59bcc57000, 16384, PROT_READ) = 0
mprotect(0x600000, 4096, PROT_READ) = 0
mprotect(0x7f59bce83000, 4096, PROT_READ) = 0
munmap(0x7f59bce6d000, 83694) = 0
fstat(1, {st_mode=S_IFCHR|0620, st_rdev=makedev(136, 0), ...}) = 0
mmap(NULL, 4096, ..., -1, 0) = 0x7f59bce81000
write(1, "Hello World 1\n", 14Hello World 1) = 14
exit_group(0) = ?
+++ exited with 0 +++
Each line is a syscall. The first is just after bash clones in to printf1_s, and the write syscall is near the bottom. The 21 syscalls between brk and the final fstat are devoted to loading shared libraries. This is the load-time penalty for dynamic-linking. Don't worry if this seems like a mess, we won't be using it. If you're interested in more detail, here is the full dump with walkthrough
Now let's look at the memory map for the process
Dynamic-linked printf() memory map
$ cat /proc/3177/maps
00400000-00401000 r-xp 00000000         ./printf1
00600000-00601000 r--p 00000000         ./printf1
00601000-00602000 rw-p 00001000         ./printf1
7f59bc89f000-7f59bca57000 r-xp 00000000 /usr/lib64/libc-2.17.so
7f59bca57000-7f59bcc57000 ---p 001b8000 /usr/lib64/libc-2.17.so
7f59bcc57000-7f59bcc5b000 r--p 001b8000 /usr/lib64/libc-2.17.so
7f59bcc5b000-7f59bcc5d000 rw-p 001bc000 /usr/lib64/libc-2.17.so
7f59bcc5d000-7f59bcc62000 rw-p 00000000
7f59bcc62000-7f59bcc83000 r-xp 00000000 /usr/lib64/ld-2.17.so
7f59bce6a000-7f59bce6d000 rw-p 00000000
7f59bce81000-7f59bce83000 rw-p 00000000
7f59bce83000-7f59bce84000 r--p 00021000 /usr/lib64/ld-2.17.so
7f59bce84000-7f59bce85000 rw-p 00022000 /usr/lib64/ld-2.17.so
7f59bce85000-7f59bce86000 rw-p 00000000
7fff89031000-7fff89052000 rw-p 00000000 [stack]
7fff8914e000-7fff89150000 r-xp 00000000 [vdso]
ffffffffff600000-ffffffffff601000 r-xp  [vsyscall]
Our 8kb binary fits in to three 4kb memory pages (top three lines). The standard library has been mapped in to the ~middle of the address space. Code execution begins in the code area at the top, and jumps in to the shared library as needed.
This is the last I'll mention the dynamic-linked version. We'll use the static version from now on since it's easier to trace.
Static-linked printf() syscall trace
$ strace ./printf1_s
execve("./printf1_s", ["./printf1_s"],[/*47 vars*/]) = 0
uname({sysname="Linux", nodename="...", ...}) = 0
brk(NULL) = 0x1d4a000
brk(0x1d4b1c0) = 0x1d4b1c0
arch_prctl(ARCH_SET_FS, 0x1d4a880) = 0
brk(0x1d6c1c0) = 0x1d6c1c0
brk(0x1d6d000) = 0x1d6d000
fstat(1, {st_mode=S_IFCHR|0620, st_rdev=makedev(136, 0), ...}) = 0
mmap(NULL, 4096, ..., -1, 0) = 0x7faad3151000
write(1, "Hello World 1\n", 14Hello World 1) = 14
exit_group(0) = ?
+++ exited with 0 +++
The static-linked binary uses far fewer syscalls. I've highlighted three of them near the bottom: fstat, mmap, and write. These occur during printf(). We'll trace this better in the next step. First, let's look at the static memory map:
Static-linked printf() memory map
$ cat /proc/3237/printf1_s
00400000-004b8000 r-xp 00000000         ./printf1_s
006b7000-006ba000 rw-p 000b7000         ./printf1_s
006ba000-006df000 rw-p 00000000         [heap]
7ffff7ffc000-7ffff7ffd000 rw-p 00000000
7ffff7ffd000-7ffff7fff000 r-xp 00000000 [vdso]
7ffffffde000-7ffffffff000 rw-p 00000000 [stack]
ffffffffff600000-ffffffffff601000 r-xp  [vsyscall]
No hint of a shared library. That's because all the code is now included on the first two lines within the printf1_s binary. The static binary is using 187 pages of memory, just short of 800kb. This follows what we know about the large binary size.
Now we'll move on to the more interesting part: execution.
Step 6 - printf call jumps to the standard library
Goal: Follow the standard library call sequence at run-time
The programmer shapes code for the printf interface then the run-time library bridges the standard API and the OS interface.
Key point: A compiler/library is free to handle logic any way it wants between interfaces. After printf is called, there is no standard defined procedure required, except that the correct output is produced and within certain boundaries. There are many possible paths to the output, and every toolchain handles it differently. In general, this work is done in two parts: A platform-independent side where a call to printf solves the format substitution problem (Step-6, Step 7). The other is a platform-dependent side, which calls in to the OS kernel using the properly-formatted string (Step 8).
The next three steps will focus solely on the static-linked version of printf. It's less tedious to trace static-linked source, especially through the kernel in the next few steps. Note that the number of instructions executed between both are ~2300 for dynamic and ~1600 for static.
In addition to printf, compliant C compilers also implement:
fprintf() - A generalized version of printf except the output can go to any file stream, not just the console. fprintf is notable the C standard defines supported format types in its description. fprintf() isn't used, but it's good to know about since it's related to the next function
vfprintf() - Similar to fprintf except the variadic arguments are reduced to a single pointer to a va_list. libc does almost all printing work in this function, including format replacement. (f)printf merely calls vfprintf almost immediately. vfprintf then uses the libio interface to write final strings to streams.
These high-level print functions obey buffering rules defined on the stream descriptor. The output string is constructed in the buffer using internal GCC (libio) functions. Finally, write is the final step before handing work to the kernel. If you aren't familiar with how these work, I recommend reading about the GCC way of managing I/O
Bonus: Some extra reading about buffering with nice diagrams
Let's trace our path through the standard library
| printf() execution sequence | ...printf execution continued | |
|---|---|---|
| $ gdb ./printf1_s ... main at printf1.c:5 5 printf("Hello World %d\n", 1); 0x400e02 5 printf("Hello World %d\n", 1); 0x401d30 in printf () 0x414600 in vfprintf () 0x40c110 in strchrnul () 0x414692 in vfprintf () 0x423c10 in _IO_new_file_xsputn () 0x424ba0 in _IO_new_file_overflow () 0x425ce0 in _IO_doallocbuf () 0x4614f0 in _IO_file_doallocate () 0x4235d0 in _IO_file_stat () 0x40f8b0 in _fxstat () ### fstat syscall 0x461515 in _IO_file_doallocate () 0x410690 in mmap64 () ### mmap syscall 0x46155e in _IO_file_doallocate () 0x425c70 in _IO_setb () 0x461578 in _IO_file_doallocate () 0x425d15 in _IO_doallocbuf () 0x424d38 in _IO_new_file_overflow () 0x4243c0 in _IO_new_do_write () 0x423cc1 in _IO_new_file_xsputn () 0x425dc0 in _IO_default_xsputn () ...cut 11 repeats of last 2 functions... 0x425e7c in _IO_default_xsputn () | 0x423d02 in _IO_new_file_xsputn () 0x41475e in vfprintf () 0x414360 in _itoa_word () 0x4152bb in vfprintf () 0x423c10 in _IO_new_file_xsputn () 0x40b840 in mempcpy () 0x423c6d in _IO_new_file_xsputn () 0x41501f in vfprintf () 0x40c110 in strchrnul () 0x414d1e in vfprintf () 0x423c10 in _IO_new_file_xsputn () 0x40b840 in mempcpy () 0x423c6d in _IO_new_file_xsputn () 0x424ba0 in _IO_new_file_overflow () 0x4243c0 in _IO_new_do_write () 0x4235e0 in _IO_new_file_write () 0x40f9c7 in write () 0x40f9c9 in __write_nocancel () ### write syscall happens here 0x423623 in _IO_new_file_write () 0x42443c in _IO_new_do_write () 0x423cc1 in _IO_new_file_xsputn () 0x414d3b in vfprintf () 0x408450 in free () 0x41478b in vfprintf () 0x408450 in free () 0x414793 in vfprintf () 0x401dc6 in printf () main at printf1.c:6 |
This call trace shows the entire execution for this printf example. If you stare closely at this code trace, we can follow this basic logic:
- printf passes string and formats to vfprintf
- vfprintf starts to parse and attempts its first buffered write
- Oops - buffer needs to be allocated. Let's find some memory
- vfprintf back to parsing...
- Copy some results to a final location
- We're done -- call write()
- Clean up this mess
Let's look at some of the functions:
_IO_*These functions are part of GCC's libio module, which manage the internal stream buffer. Just looking at the names, we can guess that there is a lot of writing and memory allocation. The source code for most of these operations is in the files fileops.c and genops.c.
_fxstat pulls the state of file descriptors. Since this is system dependent, it's located at /sysdeps/unix/sysv/linux/fxstat64.c.
The remaining functions are covered in detail in the next two steps.
Let's dig more!
Step 7 - Format string resolved
Goal: Solve the format problem
Let's think about our input string, Hello World %d\n. There are three distinct sections that need to be processed as we scan across is from left to right.
'Hello World '- simple put%d- substitute the integer literal '1'\n- simple put
Now referring back to our trace, we can find three code sections that suggest where to look for the formatting work:
0x400e02 5  printf("Hello World %d\n", 1);
0x401d30 in printf ()
0x414600 in vfprintf ()
0x40c110 in strchrnul ()           # string scanning
0x414692 in vfprintf ()
0x423c10 in _IO_new_file_xsputn () # buffering 'Hello World '
...
0x41475e in vfprintf ()
0x414360 in _itoa_word ()          # converting integer
0x4152bb in vfprintf ()
0x423c10 in _IO_new_file_xsputn () # buffering '1'
...
0x41501f in vfprintf ()
0x40c110 in strchrnul ()           # string scanning
0x414d1e in vfprintf ()
0x423c10 in _IO_new_file_xsputn () # buffering '\n'
...
A few function calls after that final vfprintf() call is the hand off to the kernel. The formatting must have happened in vfprintf between the instructions indicated above. All substitutions handed pointers to the finished string to libio for line buffering. Let's take a peek at the first round only:
The hand off to xsputn requires vfprintf to identify the start location in the string and a size. The start is already known (current position), but it's up to strchrnul() to find a pointer to the start of the next '%' or the end of string. We can follow the parsing rules in GCC source code (/stdio-common/printf-*).
from glibc/stdio-common/printf-parse.h:

/* Find the next spec in FORMAT, or the end of the string.  Returns
   a pointer into FORMAT, to a '%' or a '\0'.  */
__extern_always_inline const unsigned char *
__find_specmb (const unsigned char *format)
{
  return (const unsigned char *) __strchrnul ((const char *) format, '%');
}
Or we can look in the compiled binary (my preferred timesink):
in vfprintf:
  0x414668 <+104>: mov    esi,0x25   # Setting ESI to the '%' symbol
  0x41466d <+109>: mov    rdi,r12    # Pointing RDI to the format string
  ...saving arguments...
  0x41468d <+141>: call   0x40c110 <strchrnul> # Search for next % or end

in strchrnul:
  0x40c110 <+0>: movd   xmm1,esi   # Loading up an SSE register with '%'
  0x40c114 <+4>: mov    rcx,rdi    # Moving the format string pointer
  0x40c117 <+7>: punpcklbw xmm1,xmm1 # Vector-izing '%' for a fast compare
  ...eventual return of a pointer to the next token...
Long story short, we've located where formats are found and processed.
That's going to be the limit of peeking at source code for glibc. I don't want this article to become an ugly mess. In any case, the buffer is ready to go after all three format processing steps.
Step 8 - Final string written to standard output
Goal: Follow events leading up to the kernel syscall
The formatted string, "Hello World 1", now lives in a buffer as part of the stdout file stream. stdout to a console is usually line buffered, but exceptions do exist. All cases for console stdout eventually lead to the 'write' syscall, which is prototyped for the particular system. UNIX(-like) systems conform to the POSIX standard, if only unofficially. POSIX defines the write syscall:
ssize_t write(int fildes, const void *buf, size_t nbyte);
From the trace in step 6, recall that the functions leading up to the syscall are:
0x4235e0 in _IO_new_file_write ()  # libio/fileops.c
0x40f9c7 in write ()               # sysdeps/unix/sysv/linux/write.c
0x40f9c9 in __write_nocancel ()    # various macros in libc and linux
  ### write syscall happens here
The link between the compiler and operating system is the ABI, and is architecture dependent. That's why we see a jump from libc's libio code to our test case architecture code under (gcc)/sysdeps. When your standard library and OS is compiled for your system, these links are resolved and only the applicable ABI remains. The resulting write call is best understood by looking at the object code in our program (printf1_s).
First, let's tackle one of the common complaints from beginners reading glibc source code...the 1000 difference ways write() appears. At the binary level, this problem goes away after static-linking. In our case, write() == __write() == __libc_write()
$ nm printf1_s | grep write
6b8b20 D _dl_load_write_lock
41f070 W fwrite
400575 t _i18n_number_rewrite
40077f t _i18n_number_rewrite
427020 T _IO_default_write
4243c0 W _IO_do_write
4235e0 W _IO_file_write
41f070 T _IO_fwrite
4243c0 T _IO_new_do_write
4235e0 T _IO_new_file_write
421c30 T _IO_wdo_write
40f9c0 T __libc_write     ## Real write in symbol table
43b220 T __libc_writev
40f9c0 W write            ## Same address -- weak symbol
40f9c0 W __write          ## Same address -- weak symbol
40f9c9 T __write_nocancel
43b220 W writev
43b220 T __writev
So any reference to these symbols actually jumps to the same executable code. For what it's worth, writev() == __writev(), and fwrite() == _IO_fwrite
And what does __libc_write look like...?
000000000040f9c0 <__libc_write>:
  40f9c0:  83 3d c5 bb 2a 00 00   cmpl   $0x0,0x2abbc5(%rip)  # 6bb58c <__libc_multiple_threads>
  40f9c7:  75 14                  jne    40f9dd <__write_nocancel+0x14>

000000000040f9c9 <__write_nocancel>:
  40f9c9:	b8 01 00 00 00       	mov    $0x1,%eax
  40f9ce:	0f 05                	syscall
  ...cut...
Write simply checks the threading state and, assuming all is well, moves the write syscall number (1) in to EAX and enters the kernel.
Some notes:
- x86-64 Linux write syscall is 1, old x86 was 4
- rdi refers to stdout
- rsi points to the string
- rdx is the string size count
Step 9 - Driver writes output string
Goal: Show the execution steps from syscall to driver
Now we're in the kernel with rdi, rsi, and rdx holding the call parameters. Console behavior in the kernel depends on your current environment. Two opposing cases are if you're printing to native console/CLI or in a desktop pseudoterminal, such as GNOME Terminal.
I tested both types of terminals on my system and I'll walk through the desktop pseudoterminal case. Counter-intuitively, the desktop environment is easier to explain despite the extra layers of work. The PTY is also much faster -- the process has exclusive use of the pty where as many processes are aware of (and contend for) the native console.
We need to track code execution within the kernel, so let's give Ftrace a shot. We'll start by making a short script that activates tracing, runs our program, and deactivates tracing. Although execution only lasts for a few milliseconds, that's long enough to produce tens or hundreds of thousands of lines of kernel activity.
#!/bin/sh
echo function_graph > /sys/kernel/debug/tracing/current_tracer
echo 1 > /sys/kernel/debug/tracing/tracing_on
./printf1_s
echo 0 > /sys/kernel/debug/tracing/tracing_on
cat /sys/kernel/debug/tracing/trace > output
Here is what happens after our static-linked printf executes the write syscall in a GNOME Terminal:
7)           | SyS_write() {
7)           |  vfs_write() {
7)           |   tty_write() {
7) 0.053 us  |    tty_paranoia_check();
7)           |    n_tty_write() {
7) 0.091 us  |     process_echoes();
7)           |     add_wait_queue()
7) 0.026 us  |     tty_hung_up_p();
7)           |     tty_write_room()
7)           |     pty_write() {
7)           |      tty_insert_flip_string_fixed_flag()
7)           |      tty_flip_buffer_push() {
7)           |       queue_work_on()
7)+10.288 us |      } /* tty_flip_buffer_push */
7)           |      tty_wakeup()
7)+14.687 us |     } /* pty_write */
7)+57.252 us |    } /* n_tty_write */
7)+61.647 us |   } /* tty_write */
7)+64.106 us |  } /* vfs_write */
7)+64.611 us | } /* SyS_write */
This output has been culled to fit this screen. Over 1000 lines of kernel activity were cut within SyS_write, most of which were locks and the kernel scheduler. The total time spent in kernel is 65 microseconds. This is in stark contrast to the native terminal, which took over 6800 microseconds!
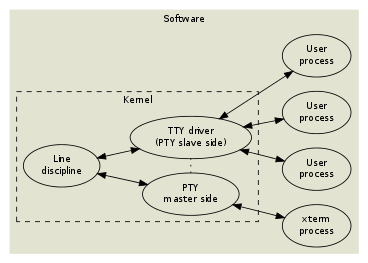
Now is a good time to step back and think about how pseudoterminals are implemented. As I was researching a good way to explain it, I happened upon an excellent write up by Linus Åkesson. He explains far better than I could. This diagram he drew up fits our case perfectly.
The TL;DR version is that pseudoterminals have a master and a slave side. A TTY driver provides the slave functionality while the master side is controlled by a terminal process.
Let's demonstrate that on my system. Recall that I'm testing through a gnome-terminal window.
$ ./printf1_s
Hello World 1
^Z
[1]+  Stopped                 ./printf1_s
$ top -o TTY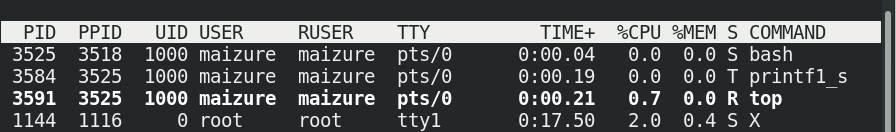
bash is our terminal parent process using pts/0. The shell forked (cloned) top and printf. Both inherited the bash stdin and stdout.
Let's take a closer look at the pts/0 device the kernel associates with our printf1_s process.
$ ls -l /dev/pts/0
crw--w----. 1 maizure tty 136, 0 Apr  1 09:55 /dev/pts/0
Notice that the pseudoterminal itself is associated with a regular tty device. It also has a major number 136. What's that?
From this linux kernel version source:include/uapi/linux/major.h
...
#define UNIX98_PTY_MASTER_MAJOR	128
#define UNIX98_PTY_MAJOR_COUNT	8
#define UNIX98_PTY_SLAVE_MAJOR	(UNIX98_PTY_MASTER_MAJOR+UNIX98_PTY_MAJOR_COUNT)
...
Yes, this major number is associated with a pseudoterminal slave (Master = 128, Slave = 128 + 8 = 136). A tty driver is responsible for its operation. If we revisit our write syscall trace, this makes sense:
...cut from earlier
7)           |  pty_write() {
7)           |      tty_insert_flip_string_fixed_flag()
7)           |      tty_flip_buffer_push() {
7)           |          queue_work_on()
7)+10.288 us |      }
7)           |      tty_wakeup()
7)+14.687 us |  } /* pty_write */
...
The pty_write() function invokes tty_* operations, which we assume moves 'Hello World 1' to the console. So where is this console?
Step 10 - Console output buffer is updated
Goal: Put the string to the console attached to stdout
The first argument to pty_write is struct tty_struct *tty. This struct contains the console, which is created with each unique tty process. In this case, the parent terminal created the pts/0 console and each child simply points to it.
The tty has many interesting parts to look at: line discipline, driver operations, the tty buffer(s), the tty_port. In the interest of space, I'm not going to cover tty initialization since it's not on the direct path for printf -- the process was created, the tty exists, and it wants this 'Hello World 1' right now!
The string is copied to the input queue in tty_insert_flip_string_fixed_flag().
memcpy(tb->char_buf_ptr + tb->used, chars, space);
memset(tb->flag_buf_ptr + tb->used, flag, space);
tb->used += space;
copied += space;
chars += space;
This moves the data and flags to the current flip buffer. The console state is updated and the buffer is pushed:
if (port->low_latency)
    flush_to_ldisc(&buf->work);
else
    schedule_work(&buf->work);
Then the line discipline is notified to add the new string to the output window in tty_wakeup(). The typical case involves a kernel work queue, which is necessarily asynchronous. The string is waiting in the buffer with the signal to go. Now it's up to the PT master to process it.
Our master is the gnome_temrinal, which manages the window context we see on screen. The buffer will eventually stream to the console on the kernel's schedule. In a native console (not X server), this would be a segment of raw video memory. Once the pty master processes the new data...
Step 11 - Hello world!
Goal: Rejoice
$ ./printf1_s
Hello World 1

$
Success!
Now you know how it works on my system. How about yours?
FAQ
Why did you put this article together?
Recently, I was asked about how some functions are implemented several times over a short period and I couldn't find a satisfactory resource to point to. Many blog posts focused too much on digging through byzantine compiler source code. I found that approach unhelpful because the compiler and standard library are only one part of the problem. This system-wide approach gives beginners a foundation, a path to follow, and helpful experiments to adapt to their own use.
What did you leave out?
Too much! It'll have to wait until 'printf() in 2500 seconds'. In no particular order:
- Details about how glibc implements buffering
- Details of how the GNOME console manages the terminal context
- Flip buffer mechanics for ttys (similar to video backbuffers)
- More about Linux work queues used in the tty driver
- More discussion of how this process varies among architectures
- Last (and definitely least): Untangling the mess inside vfprintf
How did you get gdb to print out that trace in step 6?
I used a separate file for automating gdb input and captured the output to another file.
$cat gdbcmds
start
stepi
stepi
stepi
stepi
...about 1000 more stepi...

$gdb printf1_s -x gdbcmds > printf1_s_dump